An Introduction to D3
D3.js is a JavaScript library used to create interactive visualizations in the browser. This tutorial discusses some motivations for learning D3, presents a brief introduction to the library, and concludes with some thoughts on big data.
Why data vis?
"Big Data" is something of a buzzword, but beneath it is an important idea: that data can be so complex, it's incomprehensible.
Data visualization is an answer to this problem. Visualizations distill lots of information into something we humans can understand, typically by focusing on an aggregate or subset view of the data.
Visualizations help in two ways: communication and exploration. Take this press release about Apple's revenues:
Apple today announced financial results for its fiscal 2013 fourth quarter ended September 28, 2013. The Company posted quarterly revenue of $37.5 billion and quarterly net profit of $7.5 billion, or $8.26 per diluted share. These results compare to revenue of $36 billion and net profit of $8.2 billion, or $8.67 per diluted share, in the year-ago quarter. Gross margin was 37 percent compared to 40 percent in the year-ago quarter. International sales accounted for 60 percent of the quarter’s revenue. (source)
How long did it take you to consume this information? Now consider this stock price chart:
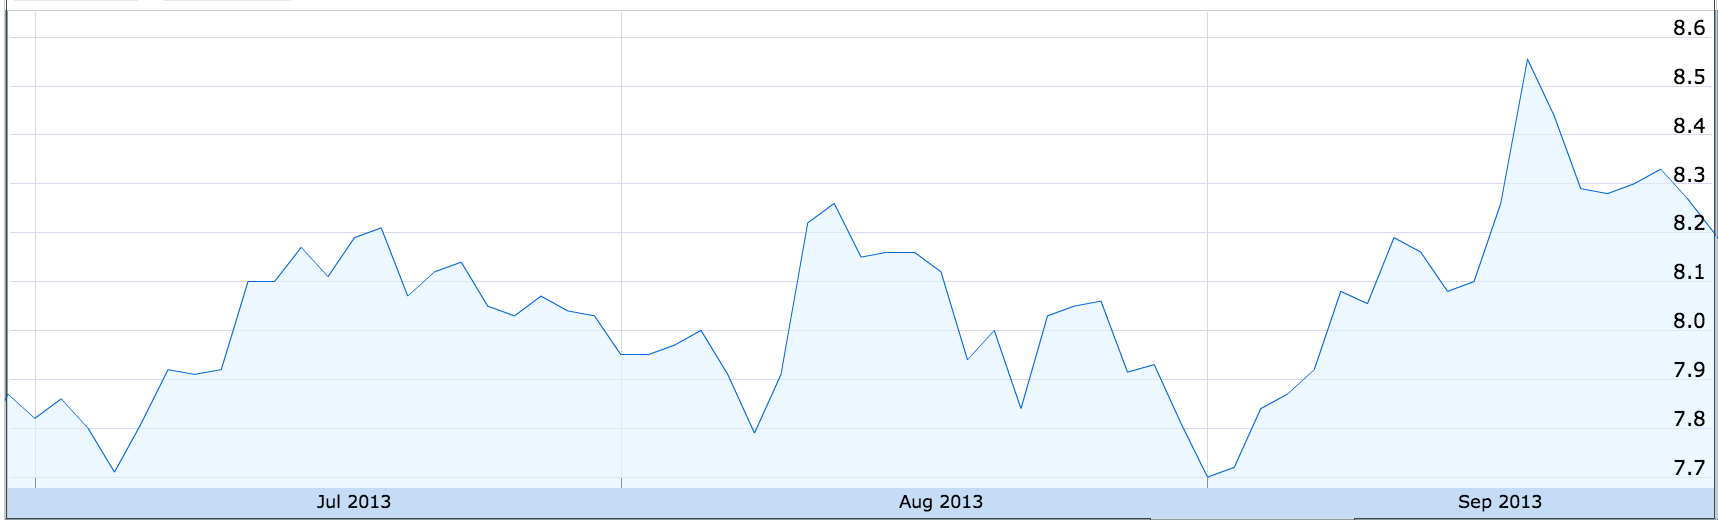
How long did it take you to understand the main trend of the chart? Do you feel like you have a better grasp of the data? By increasing the density of information, data visualization helps us communicate our insights quickly and effectively.
Visualizations also help us explore. Sometimes we don't know anything about our data, and investigating it in its raw form is impractical. We can use data vis to present the data in a form more suitable for exploration. Look at this calendar chart, which shows daily percentage changes in the DOW stock index over several years:
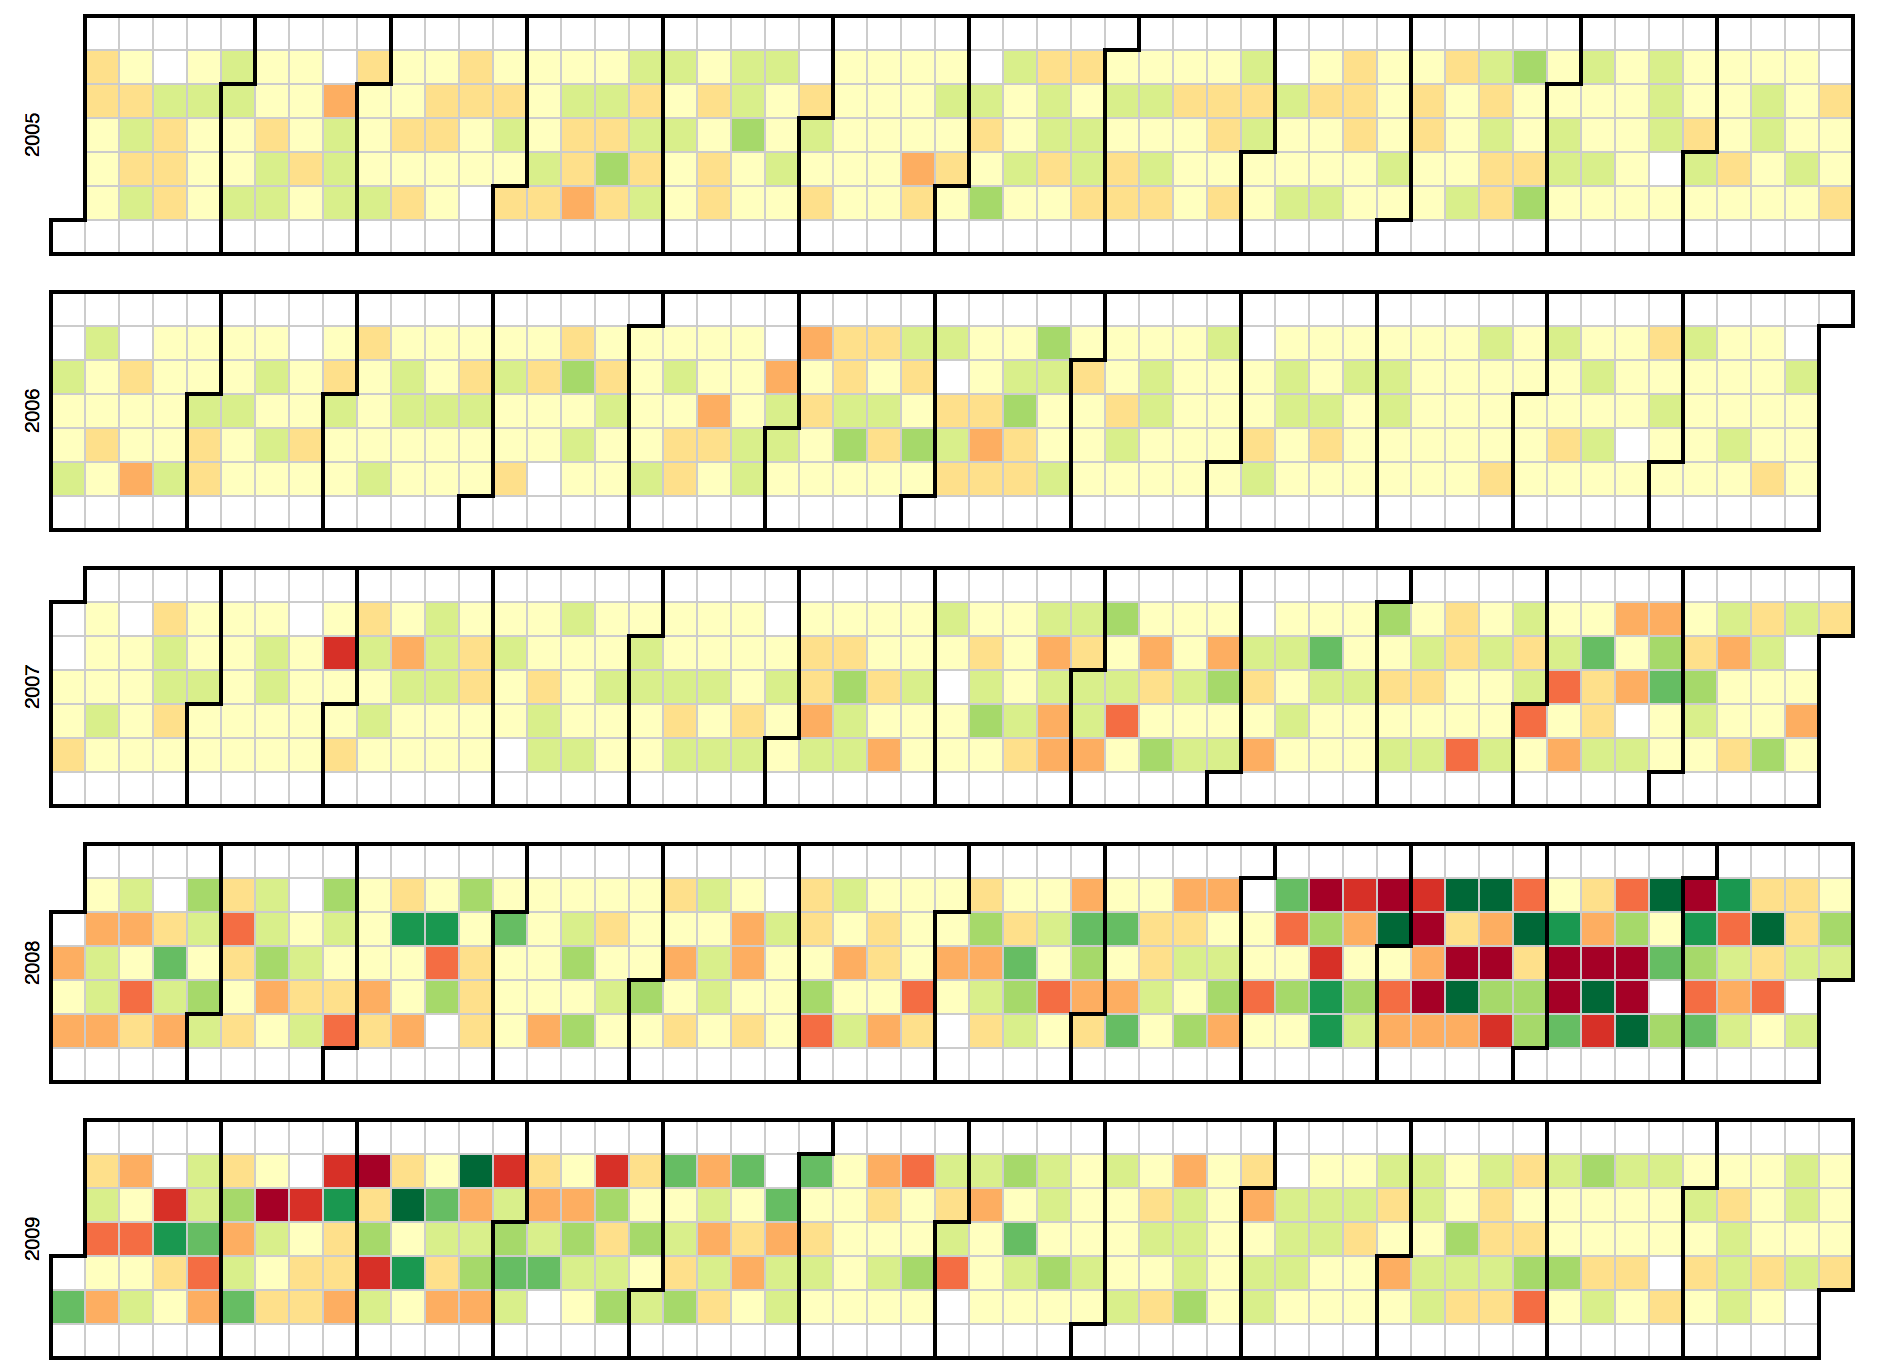
Source: http://bl.ocks.org/mbostock/4063318
With this chart, we're able to quickly scan several years of data and see if there's anything interesting; indeed, the end of 2008 seems to merit further exploration.
So data vis is about more than just making pretty charts. By facilitating communication and exploration, visualizations make our data more valuable.
What's D3?
D3 stands for Data-Driven Documents. Sounds like it could be useful for big data - but what does it mean?
The word "document" in D3 refers to the DOM, which is what you see when you view a webpage (like this one). It's the parsed and rendered HTML and CSS. But it's more than that; it's a living, breathing thing. Javascript can manipulate the DOM, creating and deleting pieces of it. It's what enables web applications to be dynamic and interactive.
At a higher level, the DOM is an agreed-upon set of terms for representing, updating, and querying information from documents. It makes CSS queries and DOM events possible. It's the raw stuff of the browser that all web developers are familiar with.
Over time, JavaScript development on the web has gotten better, and we've learned how to do some pretty cool things. We've used libraries like jQuery to iron out cross-browser issues and we've built plugins to make our UIs more interactive. But most of these innovations are related to GUI programming - because most of the time, we're building user interfaces for web applications.
But we're here to create data visualizations! And data vis isn't quite the same as GUI programming. It's about mapping data (say, a time series dataset) to elements on the screen (bars, circles, or points).
Building visualizations with tools that are suited for GUI programming is difficult and verbose. For example, if we were to set the heights of some hypothetical bars in an HTML document with vanilla JavaScript, it'd look something like this:
var nums = [80, 53, 125, 200, 28, 97];

var bars = document.getElementsByTagName("rect");
for (var i = 0; i < bars.length; i++) {
  var bar = bars.item(i);
  bar.setAttribute("height", nums[i]);
}
With D3, it's
d3.selectAll("rect").attr("height", function (d, i) {
  return nums[i];
});
In addition to using less code, the second approach has a few benefits:
D3 embraces declarative programming, and we can see that here: we're able to set the height of all elements in the collection using
.attr, rather than having to set them individually using aforloop. Declarative code abstracts away implementation details, making complicated transformations easier to reason about. It's a powerful paradigm, but definitely takes some getting used to.We're getting a little ahead of ourselves, but as you can see we're using a function to set the heights. And this function is smart; it knows about our data, and makes the relevant datum (and index) available to the transformation. This is how we can set attributes of elements in a data-driven way.
So D3 is really about giving us an API that's well-suited for creating and updating the DOM based on our data - hence the name Data-Driven Documents.
What D3 isn't
It may surprise you to learn that D3 doesn't come with any prebuilt visualizations; there's no d3.barchart, for instance. That's because D3 aims to be low-level and flexible. There are many excellent charting libraries out there, several of them built with D3. If your goal is to render a few standard charts as quickly as possible, you may want to consider using a library instead of writing D3 code by hand.
D3 is also not a compatability layer, though it does take care of a few cross-browser quirks. D3 is built to work in modern browsers.
Finally, you should know that D3 is about web standards. Recall that the first D in D3 refers to the DOM. That's web standards talk: HTML, CSS, and JavaScript. There's no new technology here, no Flash, Java applets or proprietary plugins. D3 works in any modern browser on any device, out of the box. So learning D3 involves learning about web standards and modern web development.
Can D3 help in the context of big data?
Because it is low-level, D3 may seem like a bad fit for big data analysis. Indeed, it won't help you run gigabytes of data through a model; but once you use some other tool to do this, D3 can help you make sense of the result.
Recall the two primary uses of data visualization: explanation, and exploration.
If you have some unique insight about a dataset, D3 gives you the control to communicate it effectively.
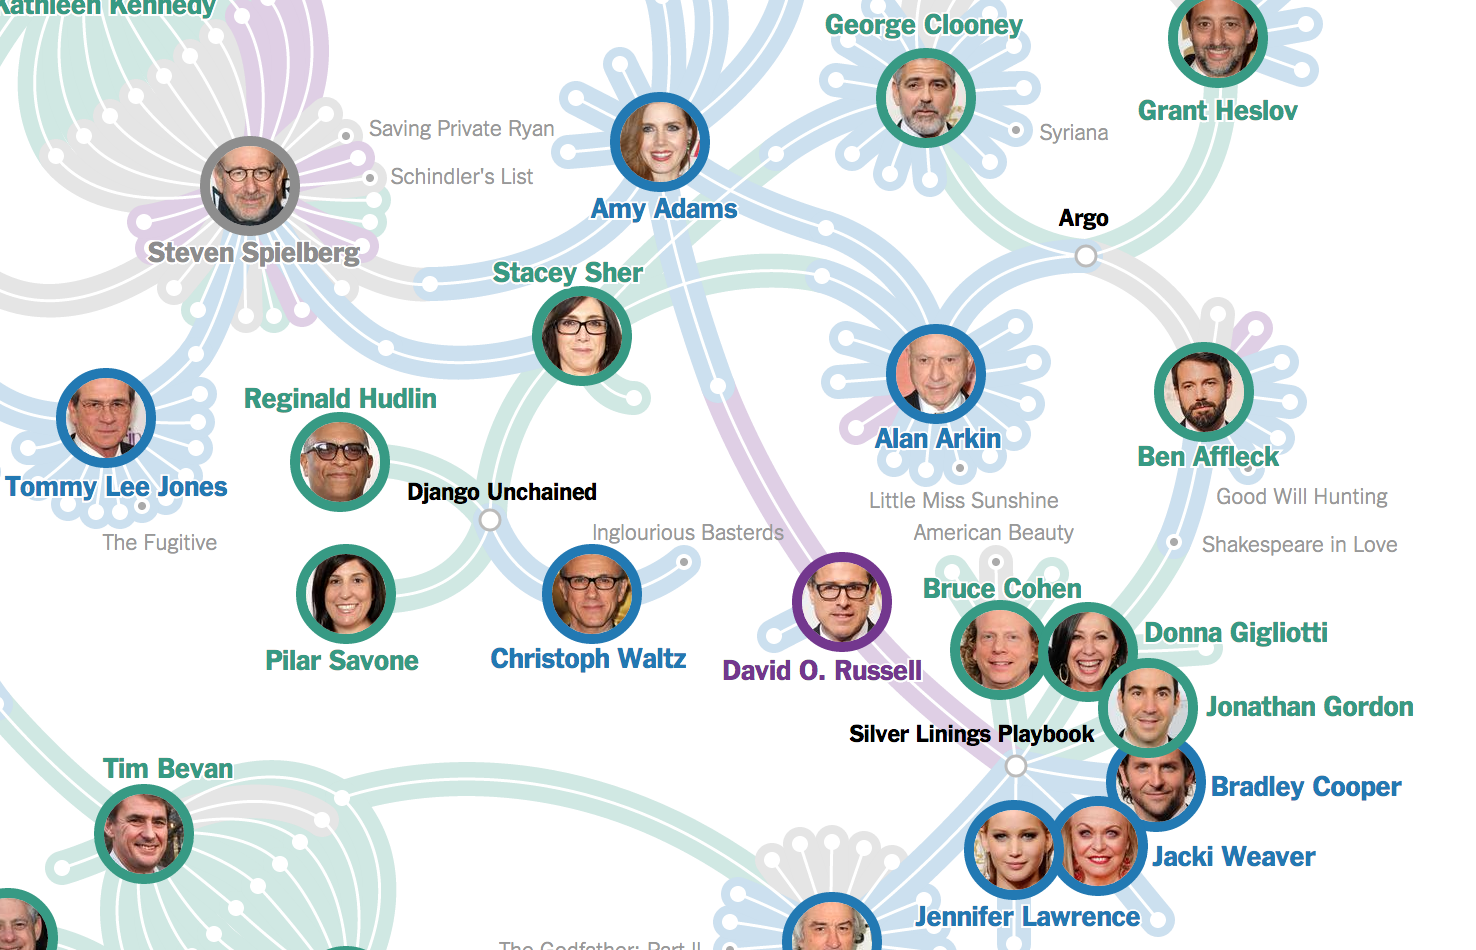
This screenshot is taken from a New York Times interactive, and shows various relationships among Oscar nominees. These authors could have written an article, but instead used data vis to create a compelling (and beautiful) diagram of their insights. This is a pretty unique visualization - and the point is, it's not found in Excel's built-in charts.
So if you have a specific idea or concept you want to explain - which people in big data often do - learning D3 can give you the power to do so in a unique and effective way.
Second, if you're focused on exploring data, D3 can be useful - but don't underestimate the learning curve. If you need to crank out a dozen pie and bar charts by the end of the week, you probably shouldn't write them from scratch using D3. Instead, use a library with built-in visualizations, like Rickshaw, Highcharts or NVD3.
Sometimes, though, existing solutions aren't enough, and you need a custom way to explore your data. Remember the calendar chart from above? It was very useful for detecting trends, and it's also not available in Excel. So D3 can be a valuable aid in data exploration, as it gives you control over your data's representation, and lets you add interactivity.
Alright, enough ceremony. Lets learn it!
Learning D3
This tutorial won't cover all the parts of the D3 toolbelt; there are plenty of existing resources that do that. Instead, it will introduce some of the library's main conceptual hurdles: selections and data bindings. Once you get a handle on these, the code in the scores of community examples should make much more sense, and with D3's documentation by your side you'll be ready to start working on your own.
I like learning through examples, so in this tutorial we'll build a simple bar chart:
Not as exciting as some of the examples you've seen, I know. But its simplicity will help us focus on D3's primitives.
The chart is rendered in SVG; open up the inspector (Command-Option-I on Mac, Ctrl-Shift-I on Windows) and see for yourself:
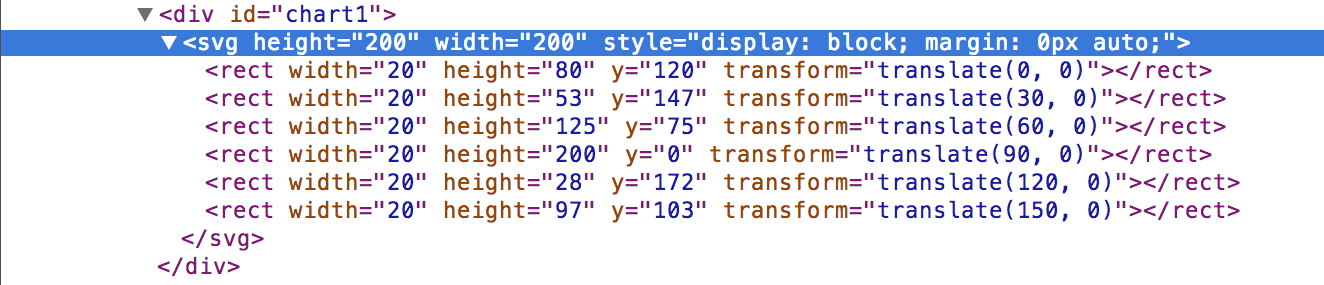
The SVG is right there in the DOM, the same place as the rest of this document. Its parsed and ready to style and manipulate.
D3 is not just about SVG; we can use it to create an HTML table, for instance. But SVG lets us do far more than we could with just CSS and the standard HTML elements.
A first look at Selections
To start out, say our initial document is
<html>
  <body>
    <script src="d3.v3.min.js" charset="utf-8"></script>
    <script>
      // Our code
    </script>
  </body>
</html>
We're referencing a local copy of D3 here; you can also link directly to the latest release with src="http://d3js.org/d3.v3.min.js".
The data driving this chart is a simple array:
var nums = [80, 53, 125, 200, 28, 97];Now, the bars are actually SVG <rect> elements. To render an SVG rectangle, we first need an <svg> container element. Let's add one to the DOM:
d3.select("body").append("svg");Breaking this down, d3 is the D3 global object - think $ from jQuery. And also similar to jQuery, d3 lets us select elements in the DOM. Here we're selecting the <body> element.
Selecting something in D3 produces a D3 selection. Selections are at the heart of D3; we'll see their full power soon. For now, just think of a selection as an object that wraps a DOM element and provides some useful methods.
One commonly used method is .style, which lets you change CSS properties. Try running this in the console: d3.select('body').style('background-color', 'blue');
Above, we used the append method on a selection to create an <svg> element. Because we typically append things to the DOM in order to do something with them, D3 conveniently returns a new selection after calling .append(). This new selection wraps the newly created element, letting us write the following:
var svg = d3.select("body").append("svg");Now, we can work with this local variable svg, just as if we had written d3.select('svg'). Since the SVG element acts as a viewport for all the other elements we'll be adding to it, we also need to set its width and height:
var svg = d3.select('body').append('svg')
+   .attr('width', 200)
+   .attr('height', 200);
Selecting arrays of elements
It's time to create some <rect> elements. One way is to just append them, like we did the svg element. We have six data points, so let's append six rectangles:
// Recall, var nums = [80, 53, 125, 200, 28, 97];

svg.append("rect");
svg.append("rect");
svg.append("rect");
svg.append("rect");
svg.append("rect");
svg.append("rect");
Indeed this works - you can try it yourself in the inspector. But this is D3, and the whole point is to use data to drive the creation of our documents. Clearly, this solution falls short. Before we see how it's really done, we need to learn more about selections.
We've seen d3.select used on single elements, like d3.select('body') and d3.select('svg'). But there's another method in D3 that produces a selection: d3.selectAll(). This selection wraps an array of all matching elements, instead of just the first matched element on the page. For example,
var paragraphs = d3.selectAll("p");returns a D3 selection wrapping all <p> tags on the page.
Even though these selections wrap arrays of element, the selection itself is still singular; there is only one selection. So, what is a selection, really? We can select single elements, or groups of them, but what does the selection itself represent?
Think of selections as higher-level than the DOM elements themselves. A selection is a managing object that references some set of elements in the DOM; it knows details about them, and can apply transformations to them, but it also knows more.
Understanding selections is central to using D3. It takes some time to wrap your head around them, so after playing with the code a bit, be sure to read as much as you can about them from the docs and other tutorials.
Now, remember when we changed the color of the <body> element earlier? If you wanted to do that for all the paragraphs in our page, you might try something like this:
paragraphs.forEach(function (p) {
  p.style("background-color", "green");
});
But this is not how we do things in D3. Remember, a selection should be thought of and acted upon as a single managing object. So when it comes time to transform elements in the DOM, you operate on the selection itself:
paragraphs.style("background-color", "green");The selection applies the transformation to each element it references.
This style of programming is called declarative programming, because we declare our intention (what we want to do), rather than imperative programming, where we write out each step our program takes to accomplish a given task (how to do it).
As you can already see, declarative programming is a powerful abstraction that reduces complexity and opens the door for more powerful code. It is the programming style D3 has adopted.
Selecting no elements
We now come to an interesting twist. Say our DOM looks like this:
<body>
  <svg>
    <rect></rect>
    <rect></rect>
    <rect></rect>
    <rect></rect>
    <rect></rect>
    <rect></rect>
  </svg>
</body>
We can use selectAll to grab the bars:
var bars = d3.selectAll("rect");which gives us a selection that wraps all six elements in the page. But what if we selected the bars before we appended them? Say our DOM looked like this
<body>
  <svg></svg>
</body>
and we wrote this
var bars = d3.selectAll("rect");Clearly, we're selecting something that doesn't exist, so it will return null - right? It's as if we applied a CSS rule to a #home element that doesn't exist, or used jQuery to find all the <h5> elements - $('h5') - but none are in the DOM. So we should get a null response, an empty set, a vacuous solution.
Actually, even though our selection is empty, the return value is not vacuous. Remember, selections are higher-level than the actual DOM elements themselves. In this case, bars doesn't refer to anything that actually exists in the DOM; but it still represents an array of <rect> elements.
So, you can think of selections as having two pieces:
The first is this Platonic piece that represents elements in the abstract; think, a single body tag, or an array of rect elements. These things don't actually exist anywhere. The second piece is the actual set of elements the selection matched in the current DOM - for example, the six <rect> elements that we can see in the inspector, right now.
Having both pieces is key to how D3 operates.
The data join and subselections
As you may have guessed, D3 can compare both parts of a selection - the elements that the selection represents, and the elements that the selection matched in the DOM - and tell us how they're similar, and how they're different.
The elements matched in the DOM simply come from the DOM - so getting them is easy. But how does D3 know what our selection should represent? So far, it has either represented a single element, or an array of elements. But how big is the array? And what are the actual elements of the array which the selection refers to? An array of rect elements is very different from an array of three rect elements whose values are 2, 5 and 10.
This is where the data join comes in. The data join gives us a way to specify exactly what our selections represent. We use it like this:
var nums = [80, 53, 125, 200, 28, 97];

var bars = svg.selectAll("rect").data(nums); // there it is!
Now we have a selection, but one that is bound to data. D3 knows exactly what that selection represents: an array of six different <rect> elements, and each element maps to the corresponding item in the array (the first <rect> corresponds to 80, the second to 53, and so on).
In this simple example, rectangles are mapped to data via their index in the array. You can use key functions for more complicated mapping.
Now that D3 knows exactly what our selection represents, and it also knows what's currently in the DOM (since it performed a .selectAll()), it can tell us what's similar and what's different between these two pieces. It does this by creating subselections: selections that represent a subset of the original selection.
There are three subselections in D3: enter, exit, and update:
Diagram adapted from http://bost.ocks.org/mike/join/
The names are appropriate:
enter refers to elements in the data that were joined to our selection, but that aren't currently in the DOM. Typically these elements will be entering the DOM via
.append()- hence the name enter.exit refers to elements in the current DOM, but not in the data that was joined to the selection. Typically these will be exiting the DOM via
.remove().update refers to elements present in both groups.
So how does this look in practice? Recall what we're trying to do: create bars. We're working with the following selection,
var nums = [80, 53, 125, 200, 28, 97];

var bars = svg.selectAll("rect").data(nums);
but the <rect> elements don't exist in the DOM. That means there are six rects in our enter subselection. We access them like this:
bars.enter();Now we have a hold of the new elements, and we can do whatever we want with them. In this case, for each element in our representation, we want to append an actual <rect> element to the DOM:
bars.enter().append("rect");If you try this out yourself, the DOM will be what you expect.
<!-- From this...  -->
<!DOCTYPE html>
<html>
  <body>
    <script src="http://d3js.org/d3.v3.min.js"></script>
    <script>
      var nums = [80, 53, 125, 200, 28, 97];

      var svg = d3
        .select("body")
        .append("svg")
        .attr("height", 200)
        .attr("width", 200);

      var bars = svg.selectAll("rect").data(nums);

      bars.enter().append("rect");
    </script>
  </body>
</html>

<!-- You get this! -->
<svg>
  <rect></rect>
  <rect></rect>
  <rect></rect>
  <rect></rect>
  <rect></rect>
  <rect></rect>
</svg>
Congratulations - you've just created your first data-driven document!
Data is stored in the DOM
You may be thinking that the data used in the join is stored in D3 somewhere. In fact, when the elements are inserted into the DOM, D3 stores the data as properties on the DOM nodes themselves. Try running the following command in the console:
document.querySelector("rect").__data__; //80As you can see, the data is available without the use of D3. It has become part of the document.
This leads us to another fact about selections: selections are transient. If you ever need to reselect elements that have been inserted into the DOM, you simply reselect them:
d3.selectAll("rect");Inspect those in the console, and you'll see the same rectangles bound to the same data. D3 provides a convenient method for returning the array of data bound to a selection: d3.selectAll('rect').data().
And with that, we're over the hump! Selections are the main hurdle in D3, and as you practice with them, the rest of the library will make much more sense.
Using data-driven transformations to finish the chart
We now have data-bound <rect> elements in the DOM. This is exciting! The elements know about their data, and it's easy for us to apply more data-driven transformations to finish our chart.
So, what's the next step? Well, you may notice that our six rectangles aren't actually rendering anything out to the screen. This is because they don't have a width or height.
Let's give them some dummy properties, and see what we're working with:
var bars = d3.selectAll("rect").attr("width", 20).attr("height", 20);Hmm, that doesn't look like six bars. Actually, if you open your inspector, you'll see that all six are there. The problem is, they're all stacked on top of each other.
Let's spread them out a bit. <rect> elements have x and y properties that control horizontal and vertical position, respectively. We'll offset the bars horizontally by changing the x property. Now, we can't just set them all to something like 10; this will move them all together. We need to move the first one a bit, the second a bit more, and so on.
Sounds like we need another data-driven transformation! Above, we created bar elements in a data-driven way by calling append on a bound selection. Once we're working with a bound selection, we can implement additional data-driven transformations using the following syntax (which you'll recognize from our very first example):
selection.attr('attrName', function(d, i) { return [expression using d/i]; });
selection.style('cssProp', function(d, i) { return [expression using d/i]; });
The second parameter of either an attribute (e.g. width on a rectangle) or a css property (e.g. opacity) can be a function, instead of just a static value. And that function accepts two parameters corresponding to the current element in the selection: d represents the current data point, and i the current index.
For this transformation, we'll use each bar's index.
bars.attr("x", function (d, i) {
  return 30 * i;
});
Finally, making some progress! Next, we need to get these boxes looking more like bars. To change the height of a <rect> element, set the height property. In this case, we want the height of each bar to equal the number in our original data array, so...
// remember, var nums = [80, 53, 125, 200, 28, 97]

bars.attr("height", function (d, i) {
  return d;
});
Success! Well, sort of. Our bars seems to have flipped themselves upside-down. What gives?
It turns out that the origin of the SVG coordinate plane is the top-left corner:
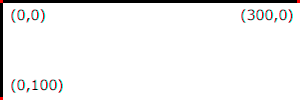
So, the "base" of each bar actually runs along the top of the <svg> element, and the height property extends a bar downward. To make our bars stand rightside-up, we can use the y offset to pull each bar down to the bottom of the <svg> element.
We want to offset each bar by the total height of the chart, less that bar's height. Since we set the height of our <svg> to 200, here's what we need to do:
bars.attr("y", function (d, i) {
  return 200 - d;
});
We did it! A simple data-driven bar chart, ripe for CSS styling and additional Javascript manipulation.
Some concluding thoughts on D3 and big data
There are, of course, many - many - more things to learn, both inside and outside the D3 library itself. Scales, axes, transitions, events, brushes...it can seem a little overwhelming. But it's also a testament to how much control D3 gives you over your visualizations. After learning this, one may wonder if such a low-level tool can really be useful for analyzing massive amounts of data. Aren't there libraries better equipped for this sort of thing?
D3 certainly doesn't provide an end-all solution to the problem of big data analysis; but it plays an important role. First off, here's a list of some data-intensive projects and companies using D3:
- Cubism and Crossfilter: display and filter 250,000 data points in real-time
- Netflix analytics
- Square analytics
- Addepar financial tools
- Localytics
- Open-source tools binding D3 to R, Python
There are many more beyond this list, but you get the idea: D3 has been making a splash among companies that deal with large amounts of data.
More importantly, trends in modern analytics are bringing interactive visualizations to the fore. Not too long ago, computer hardware was expensive and data analysis time-consuming. Running a simple model could take hours or even days, so static analysis - writing an algorithm, feeding it some data, exploring the results, and repeating - was really the only option.
But modern hardware has drastically impacted this process. Static reports have been replaced by dynamic, interactive real-time visualizations. And more companies are discovering that interactive tools are the way to gain actionable insights from their data.
This is where D3 comes in. It gives you a toolkit for building complex visualizations rich with interactivity. Traditional server-side technologies are still useful for cleaning, aggregating, reducing and filtering raw data; but when it comes to viewing and interpreting the results, you need customized, dynamic visualizations. D3 can help you build those.
Human knowledge and intuition has always played a role in data analysis. It tells us where to look, what to look for, and what to ignore. D3 lets us build tools to enhance these capabilities, giving us more control and better understanding of our data.
Learn more
This tutorial barely scratched the surface of what D3 has to offer, so here are some more resources to help you on your journey. If you don't understand things the first time around, don't get discouraged; D3 is one of those things that starts to make sense after hearing the same ideas presented in two or three different ways.
Most importantly, practice!
- Examples. Inspiring and instructive. The basic charts are a good place to start.
- Tutorials, especially
- Scott Murray's online tutorials and book
- Google forum